The Infographic Engine
Turn complexityinto clarity
Gallery
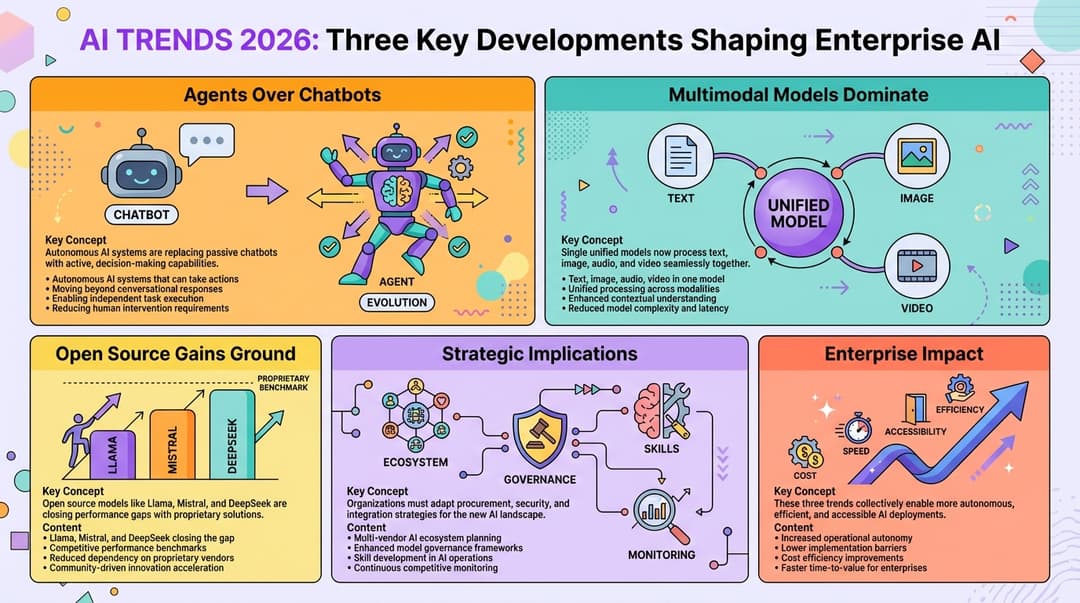
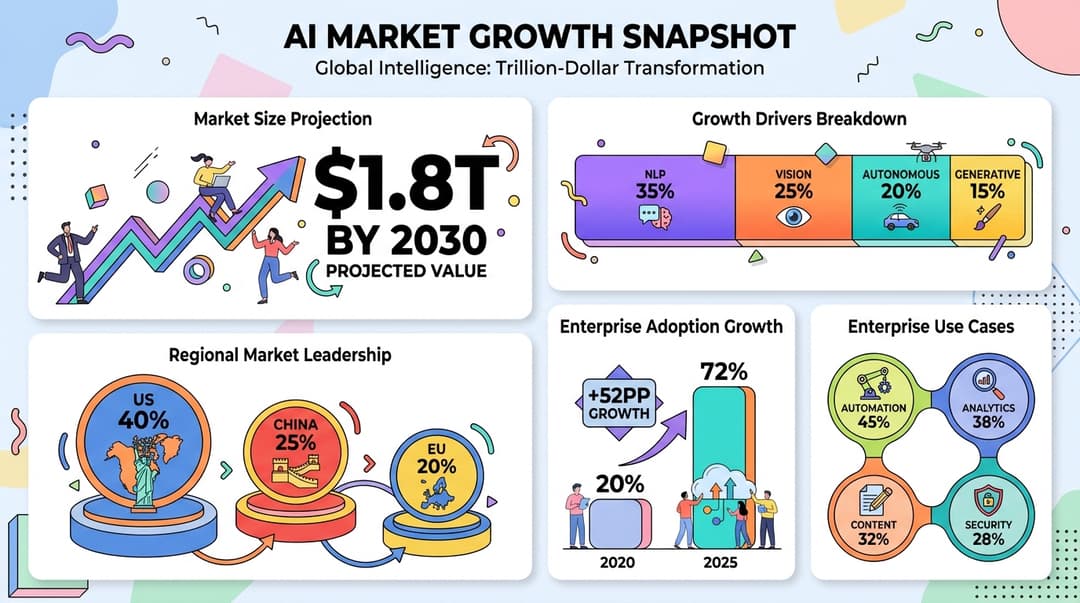
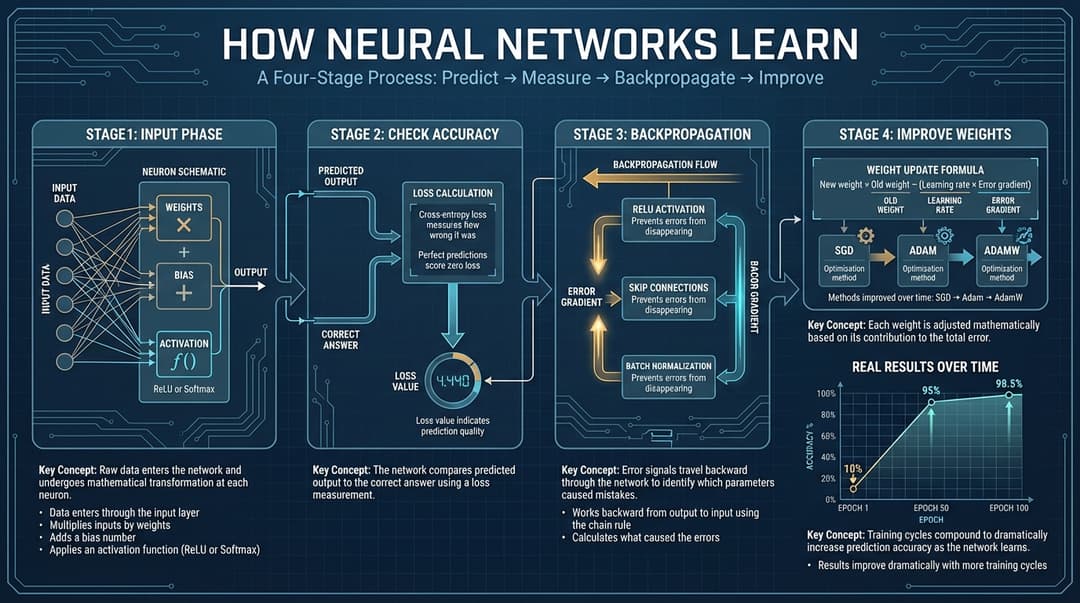
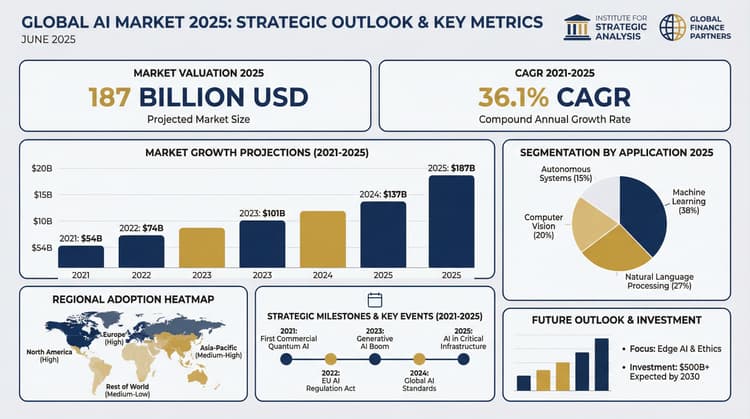
Every visual below was generated by the engine. Real research. Real data. Not mockups.


Capabilities
Built to generate.
22
SOURCES
Fact-verified by institutional sources
20
LAYOUTS
Bento, iceberg, hub, timeline & more
20
STYLES
From watercolor to technical schematic
60
SECONDS
Publication-grade, consulting-ready
7
AGENTS
Agentic pipeline, zero guesswork
3
RATIOS
16:9, 9:16, and 1:1 output
Agentic Workflow
Seven agents.
Zero guesswork.
Every infographic flows through an agentic pipeline — seven specialized AI agents, from raw content to publication-ready output in approximately 60 seconds.
Parse any format — text, URL, PDF, audio
AI finds real references & verifies facts
Rewrite at 8th-grade reading level
Select optimal layout and style combination
Organize content into visual hierarchy
Assemble multimodal generation prompt
Render with Gemini 3 Pro + reference images
Sentinel
Parse any format — text, URL, PDF, audio
Oracle
AI finds real references & verifies facts
Scribe
Rewrite at 8th-grade reading level
Strategist
Select optimal layout and style combination
Architect
Organize content into visual hierarchy
Forge
Assemble multimodal generation prompt
Renderer
Render with Gemini 3 Pro + reference images
Art & Technique
Every style has
a visual language.
Six distinct illustration techniques — each with its own visual grammar, composition rules, and aesthetic heritage.
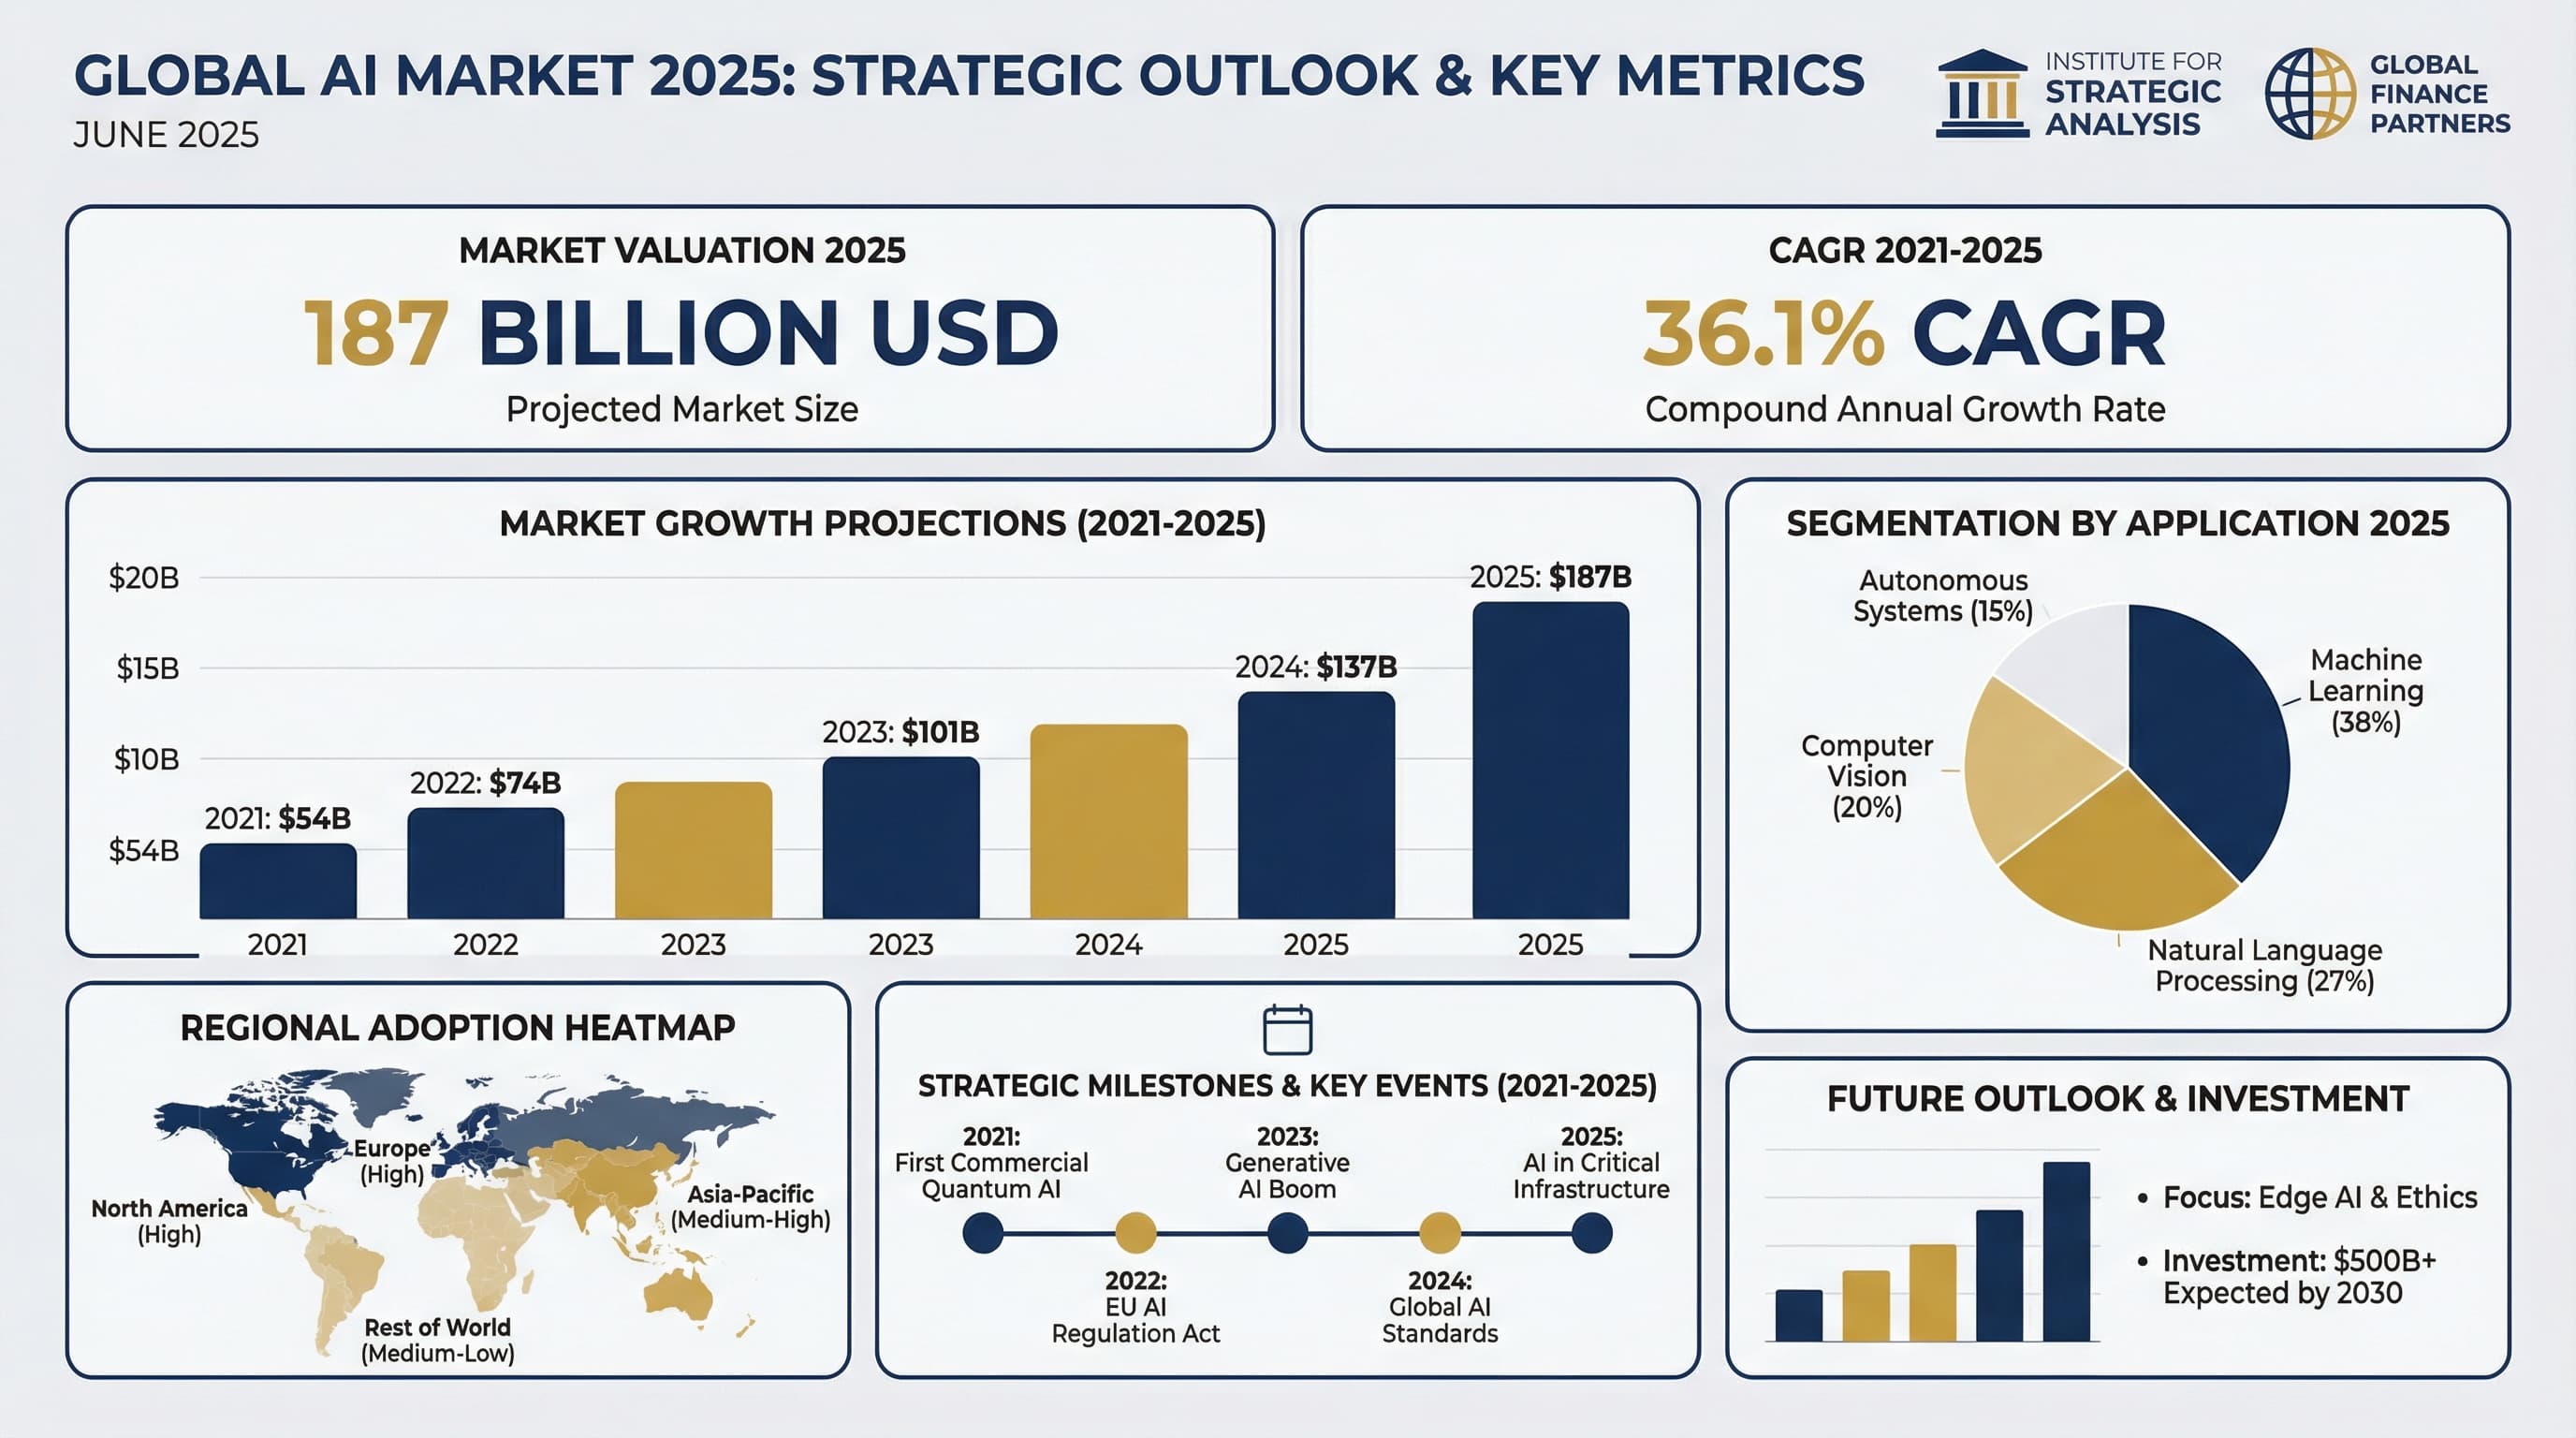
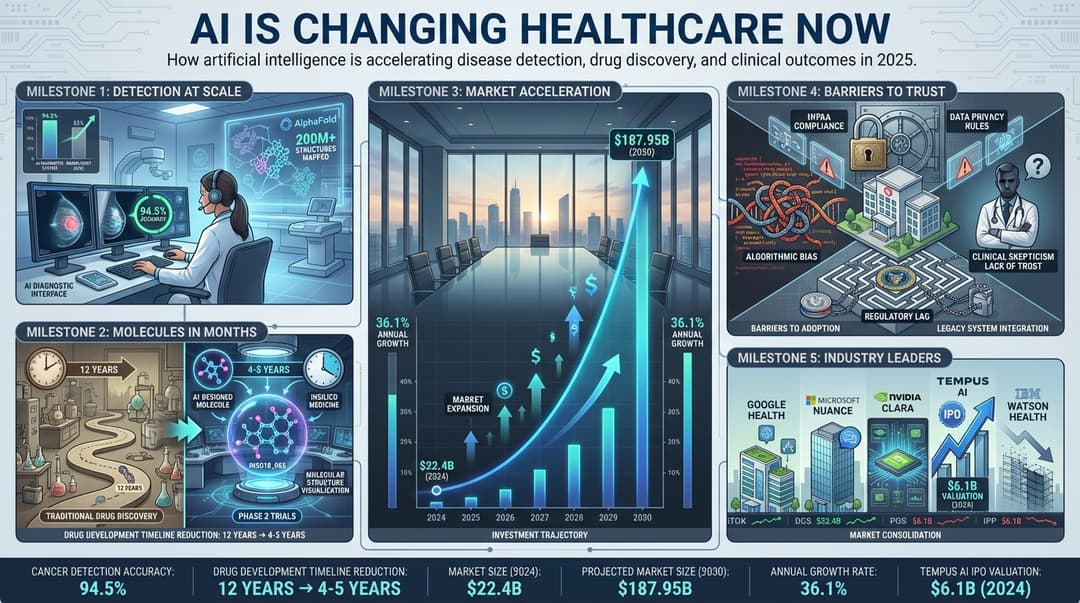
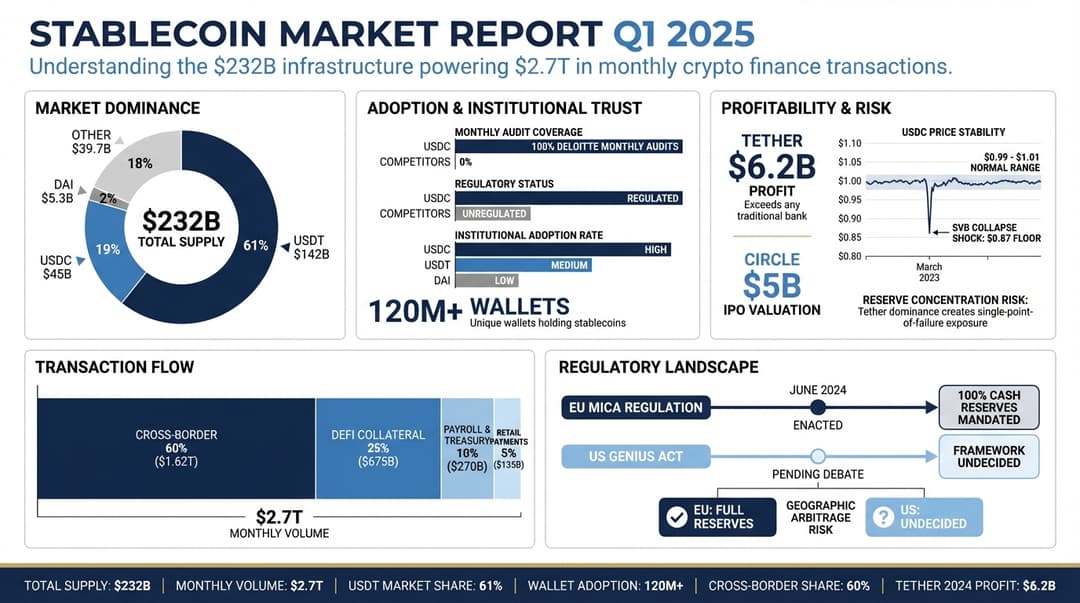
Executive Institutional
McKinsey-grade multi-panel dashboard. Data-dense KPI grids with corporate color coding, executive summaries, and chart-heavy compositions designed for boardroom presentations.
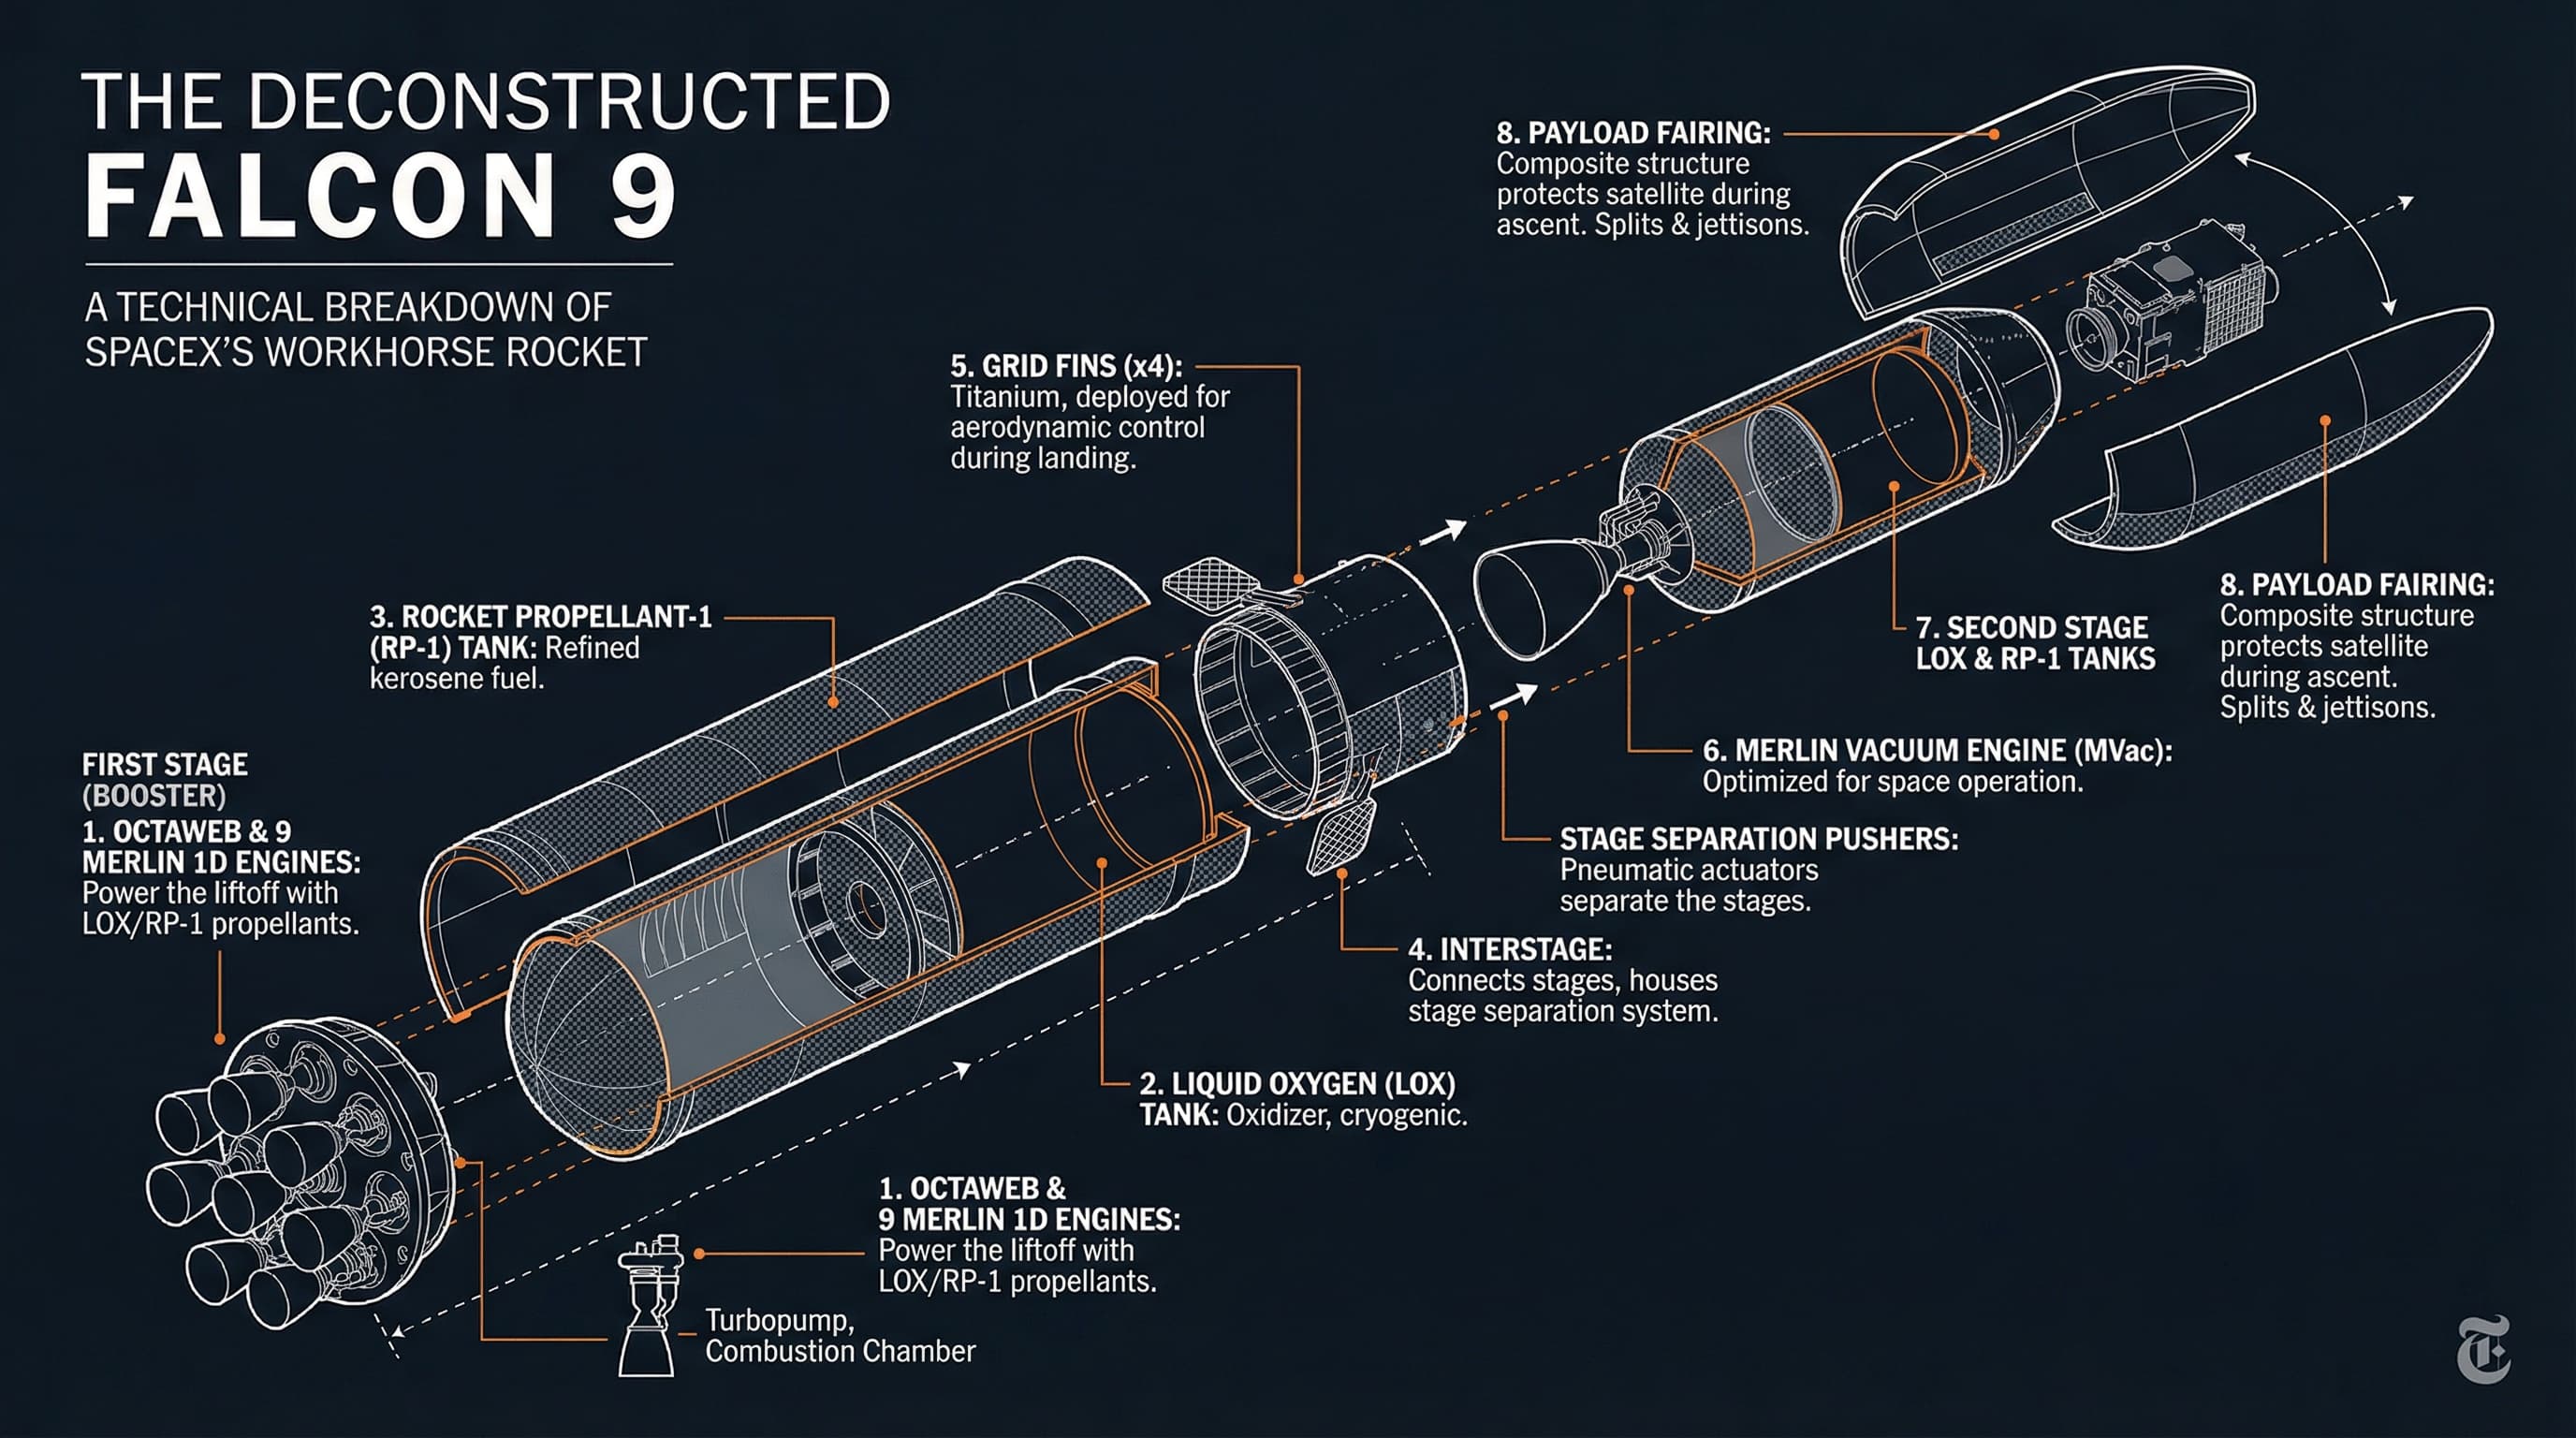
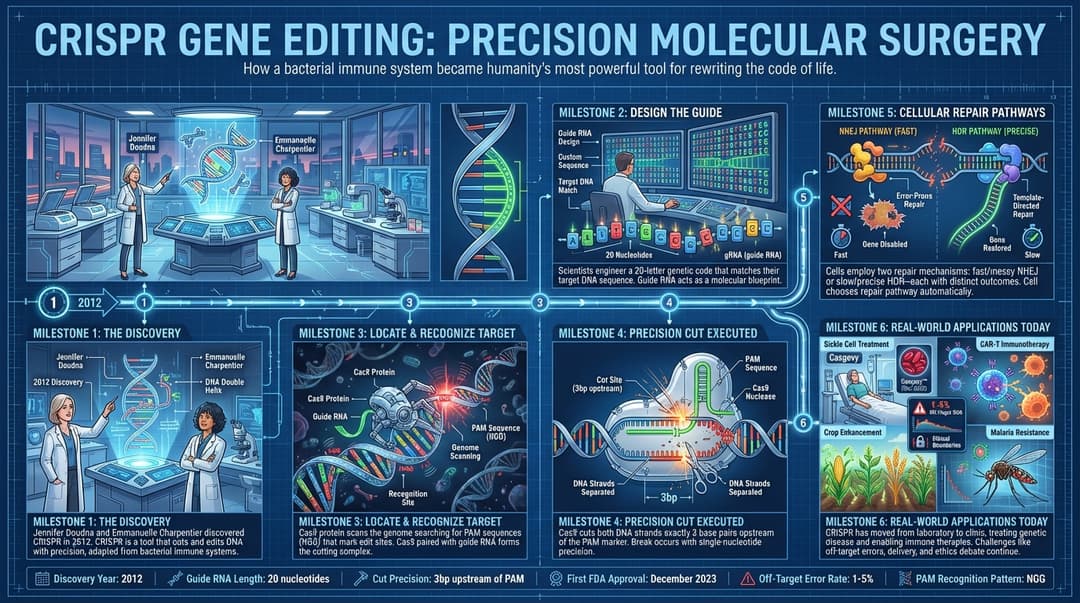
Deconstruct
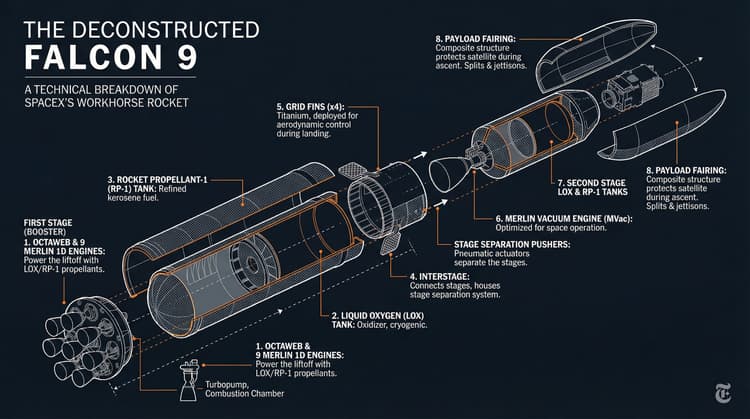
NYT-style structural breakdown with callout lines, numbered annotations, and isometric dissection. Turns complex systems into labelled mechanical drawings.
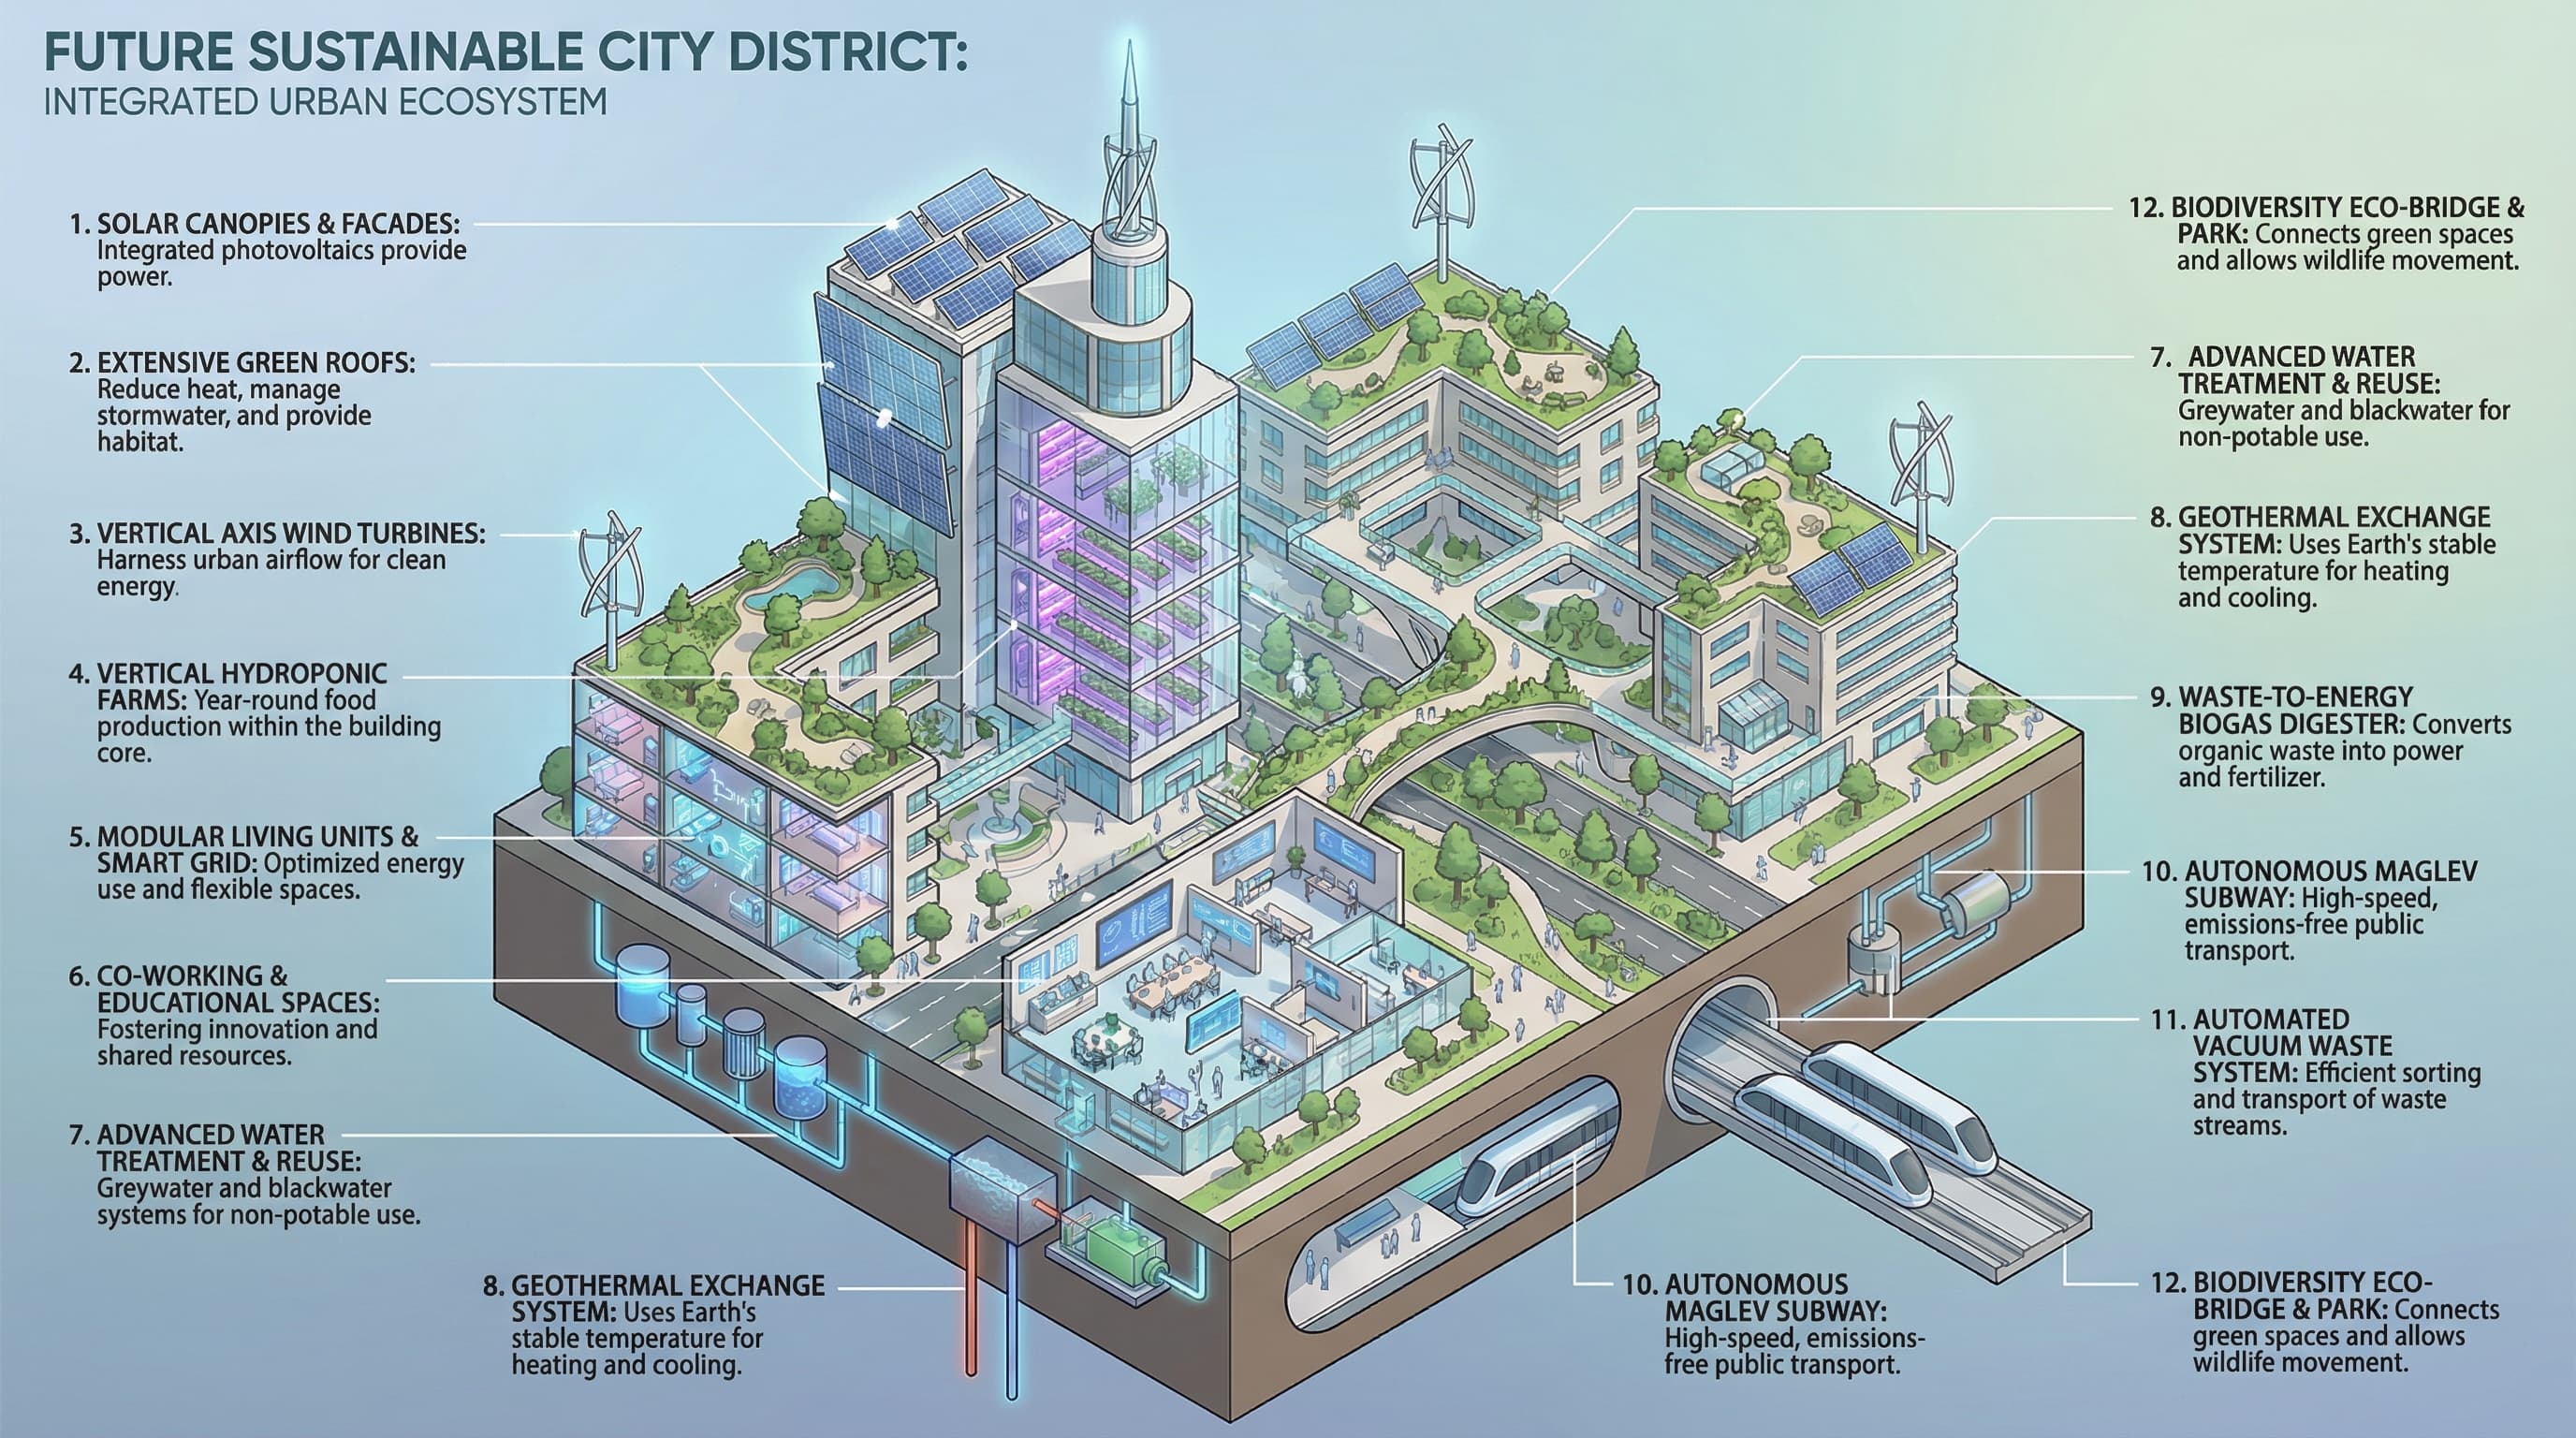
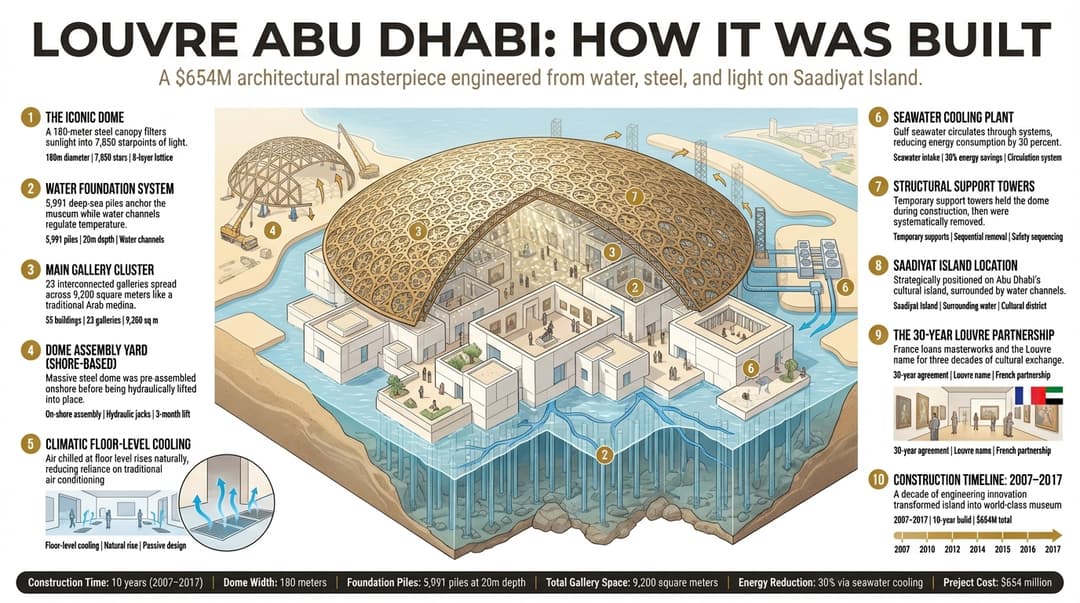
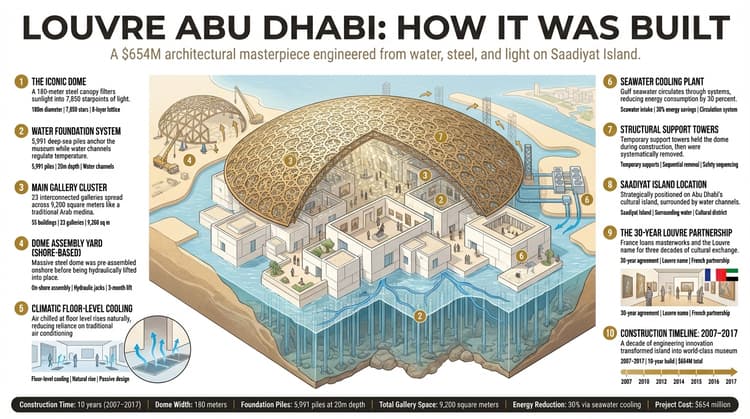
Aerial Explainer
Drone-perspective architectural rendering with numbered callouts, cross-section views, and scale references. Reveals hidden structure beneath the surface.
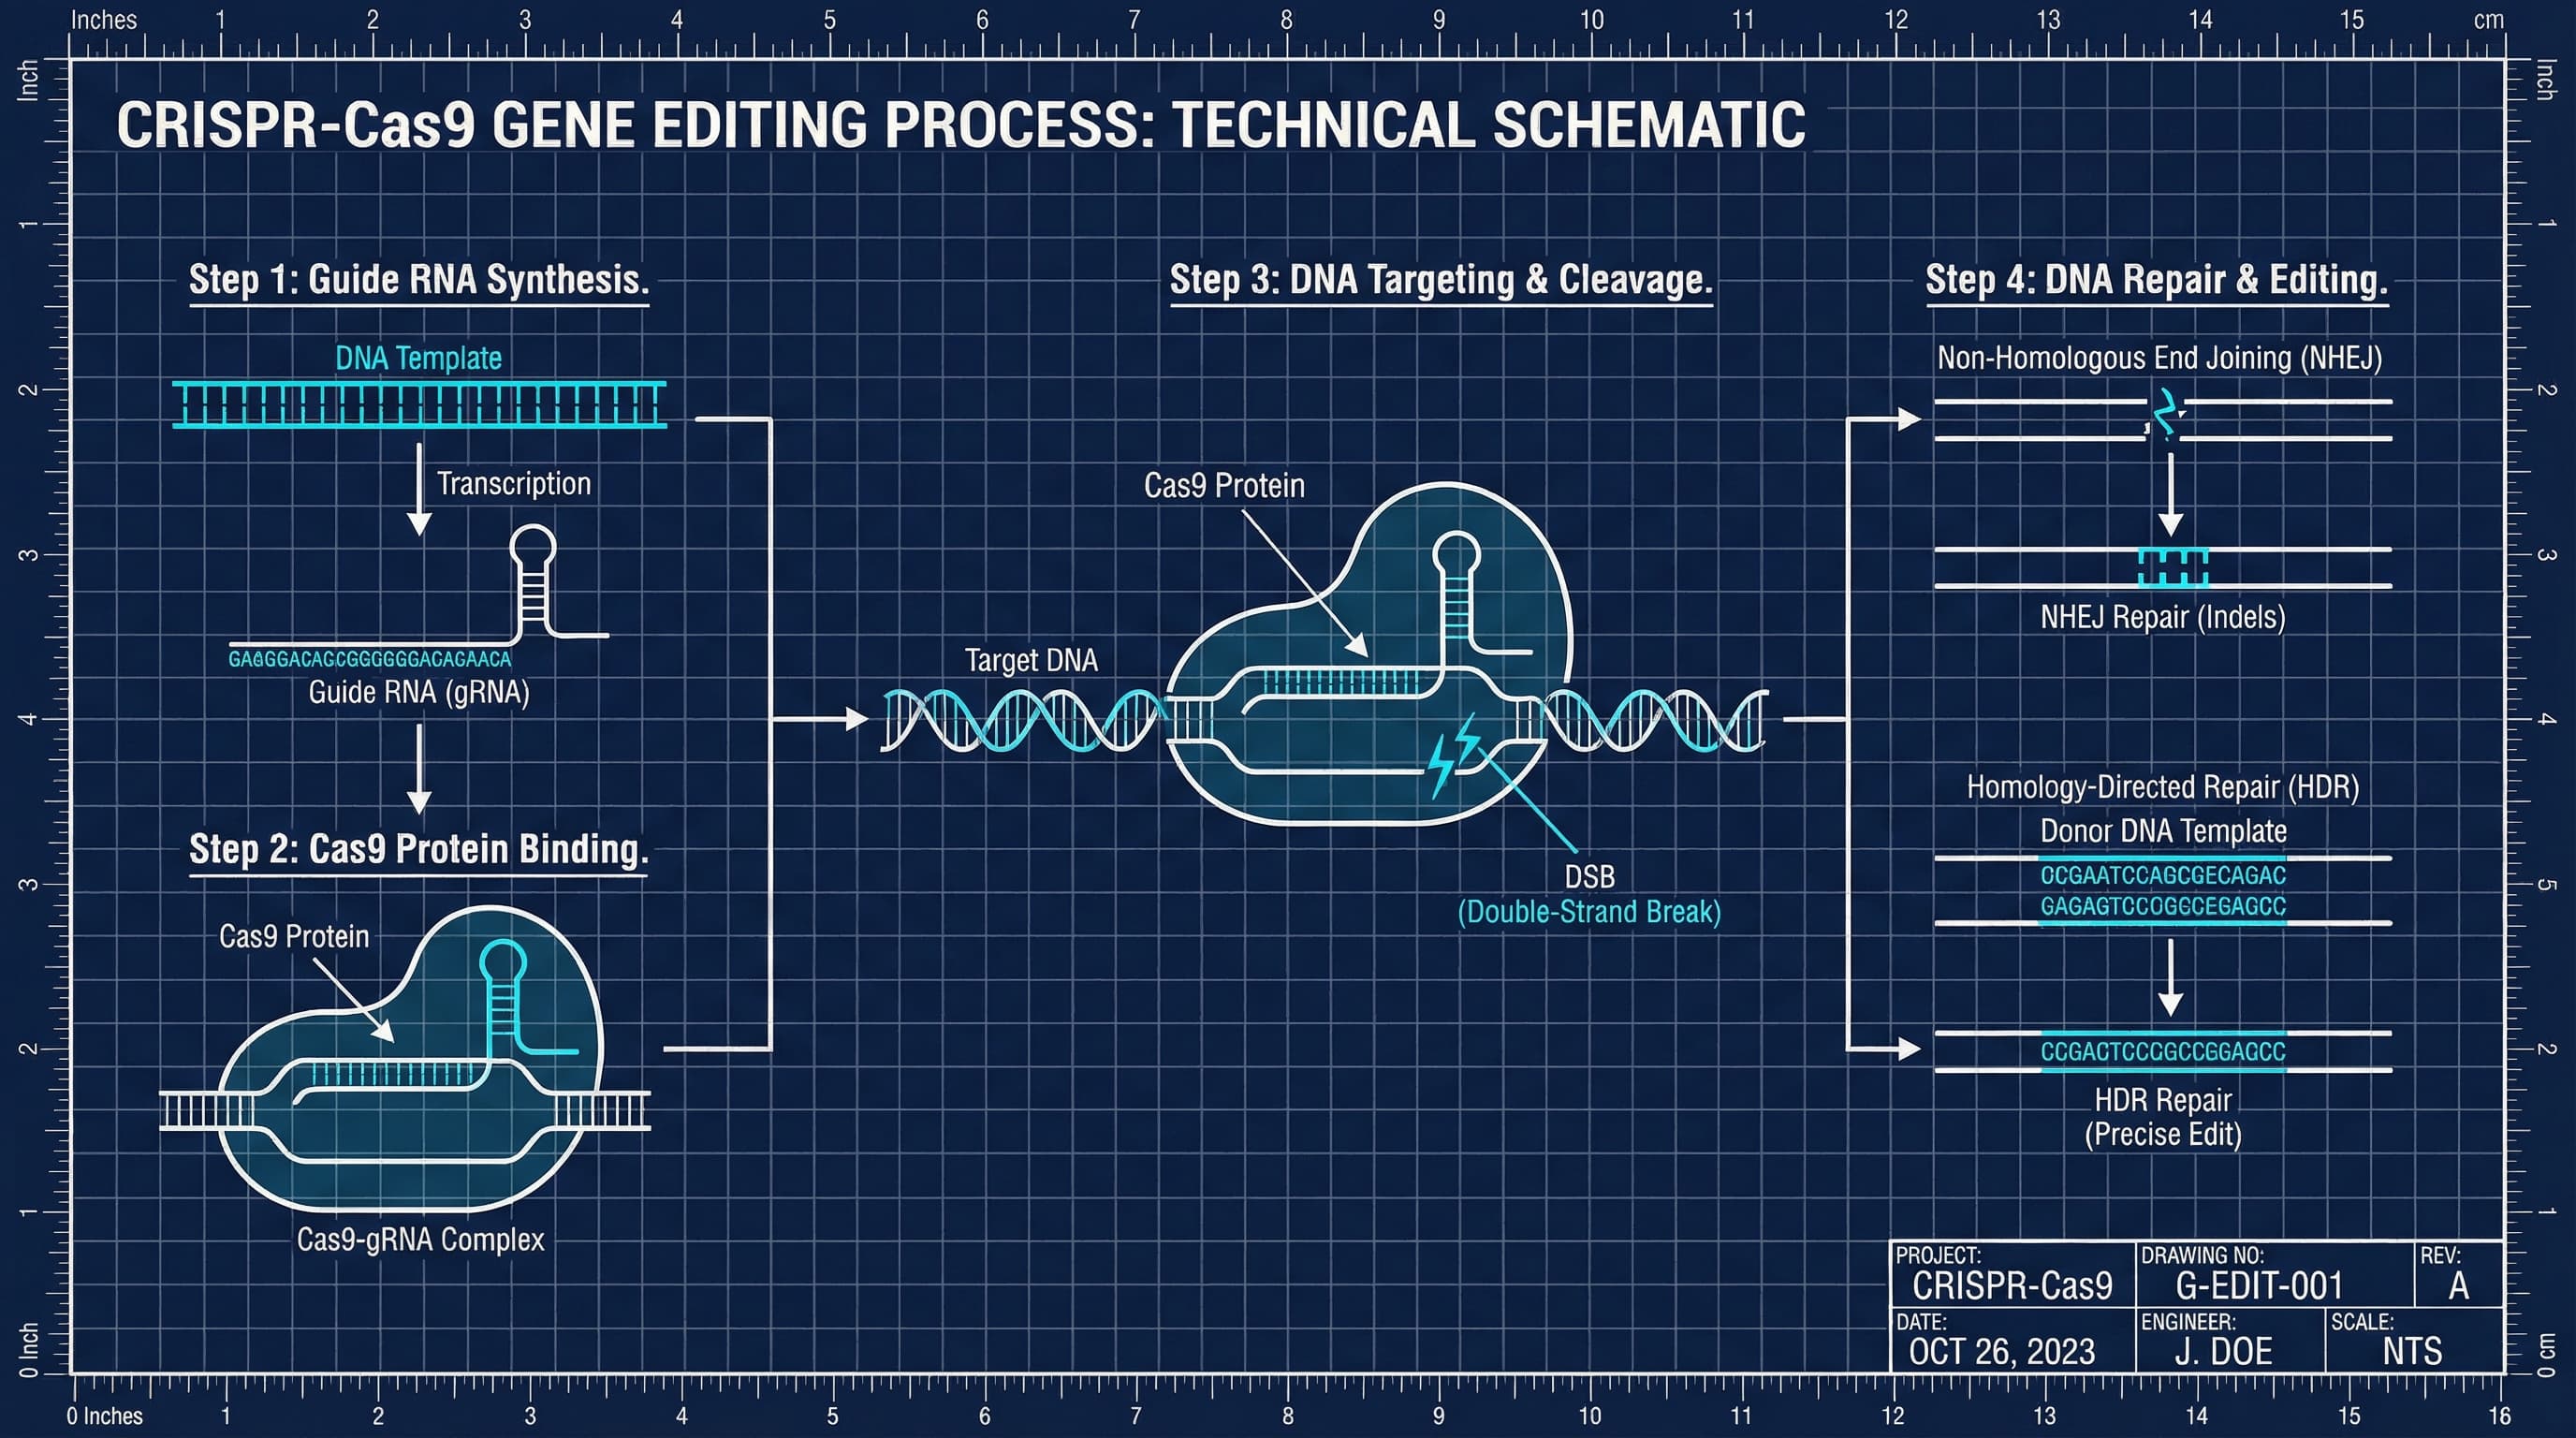
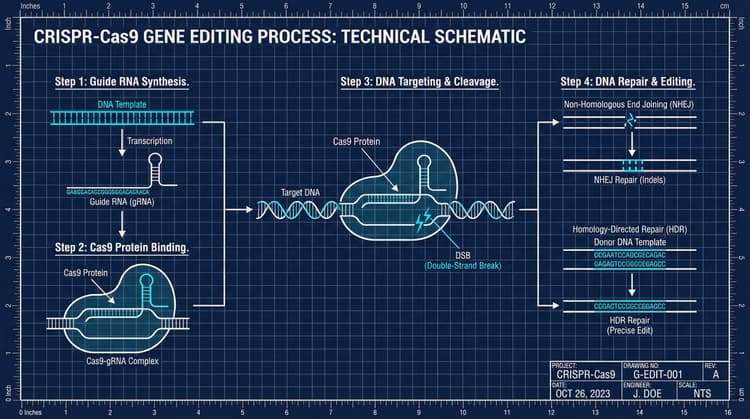
Technical Schematic
Engineering-blueprint aesthetic with precise linework, grid backgrounds, and step-by-step molecular or mechanical process flows. Data accuracy meets visual precision.
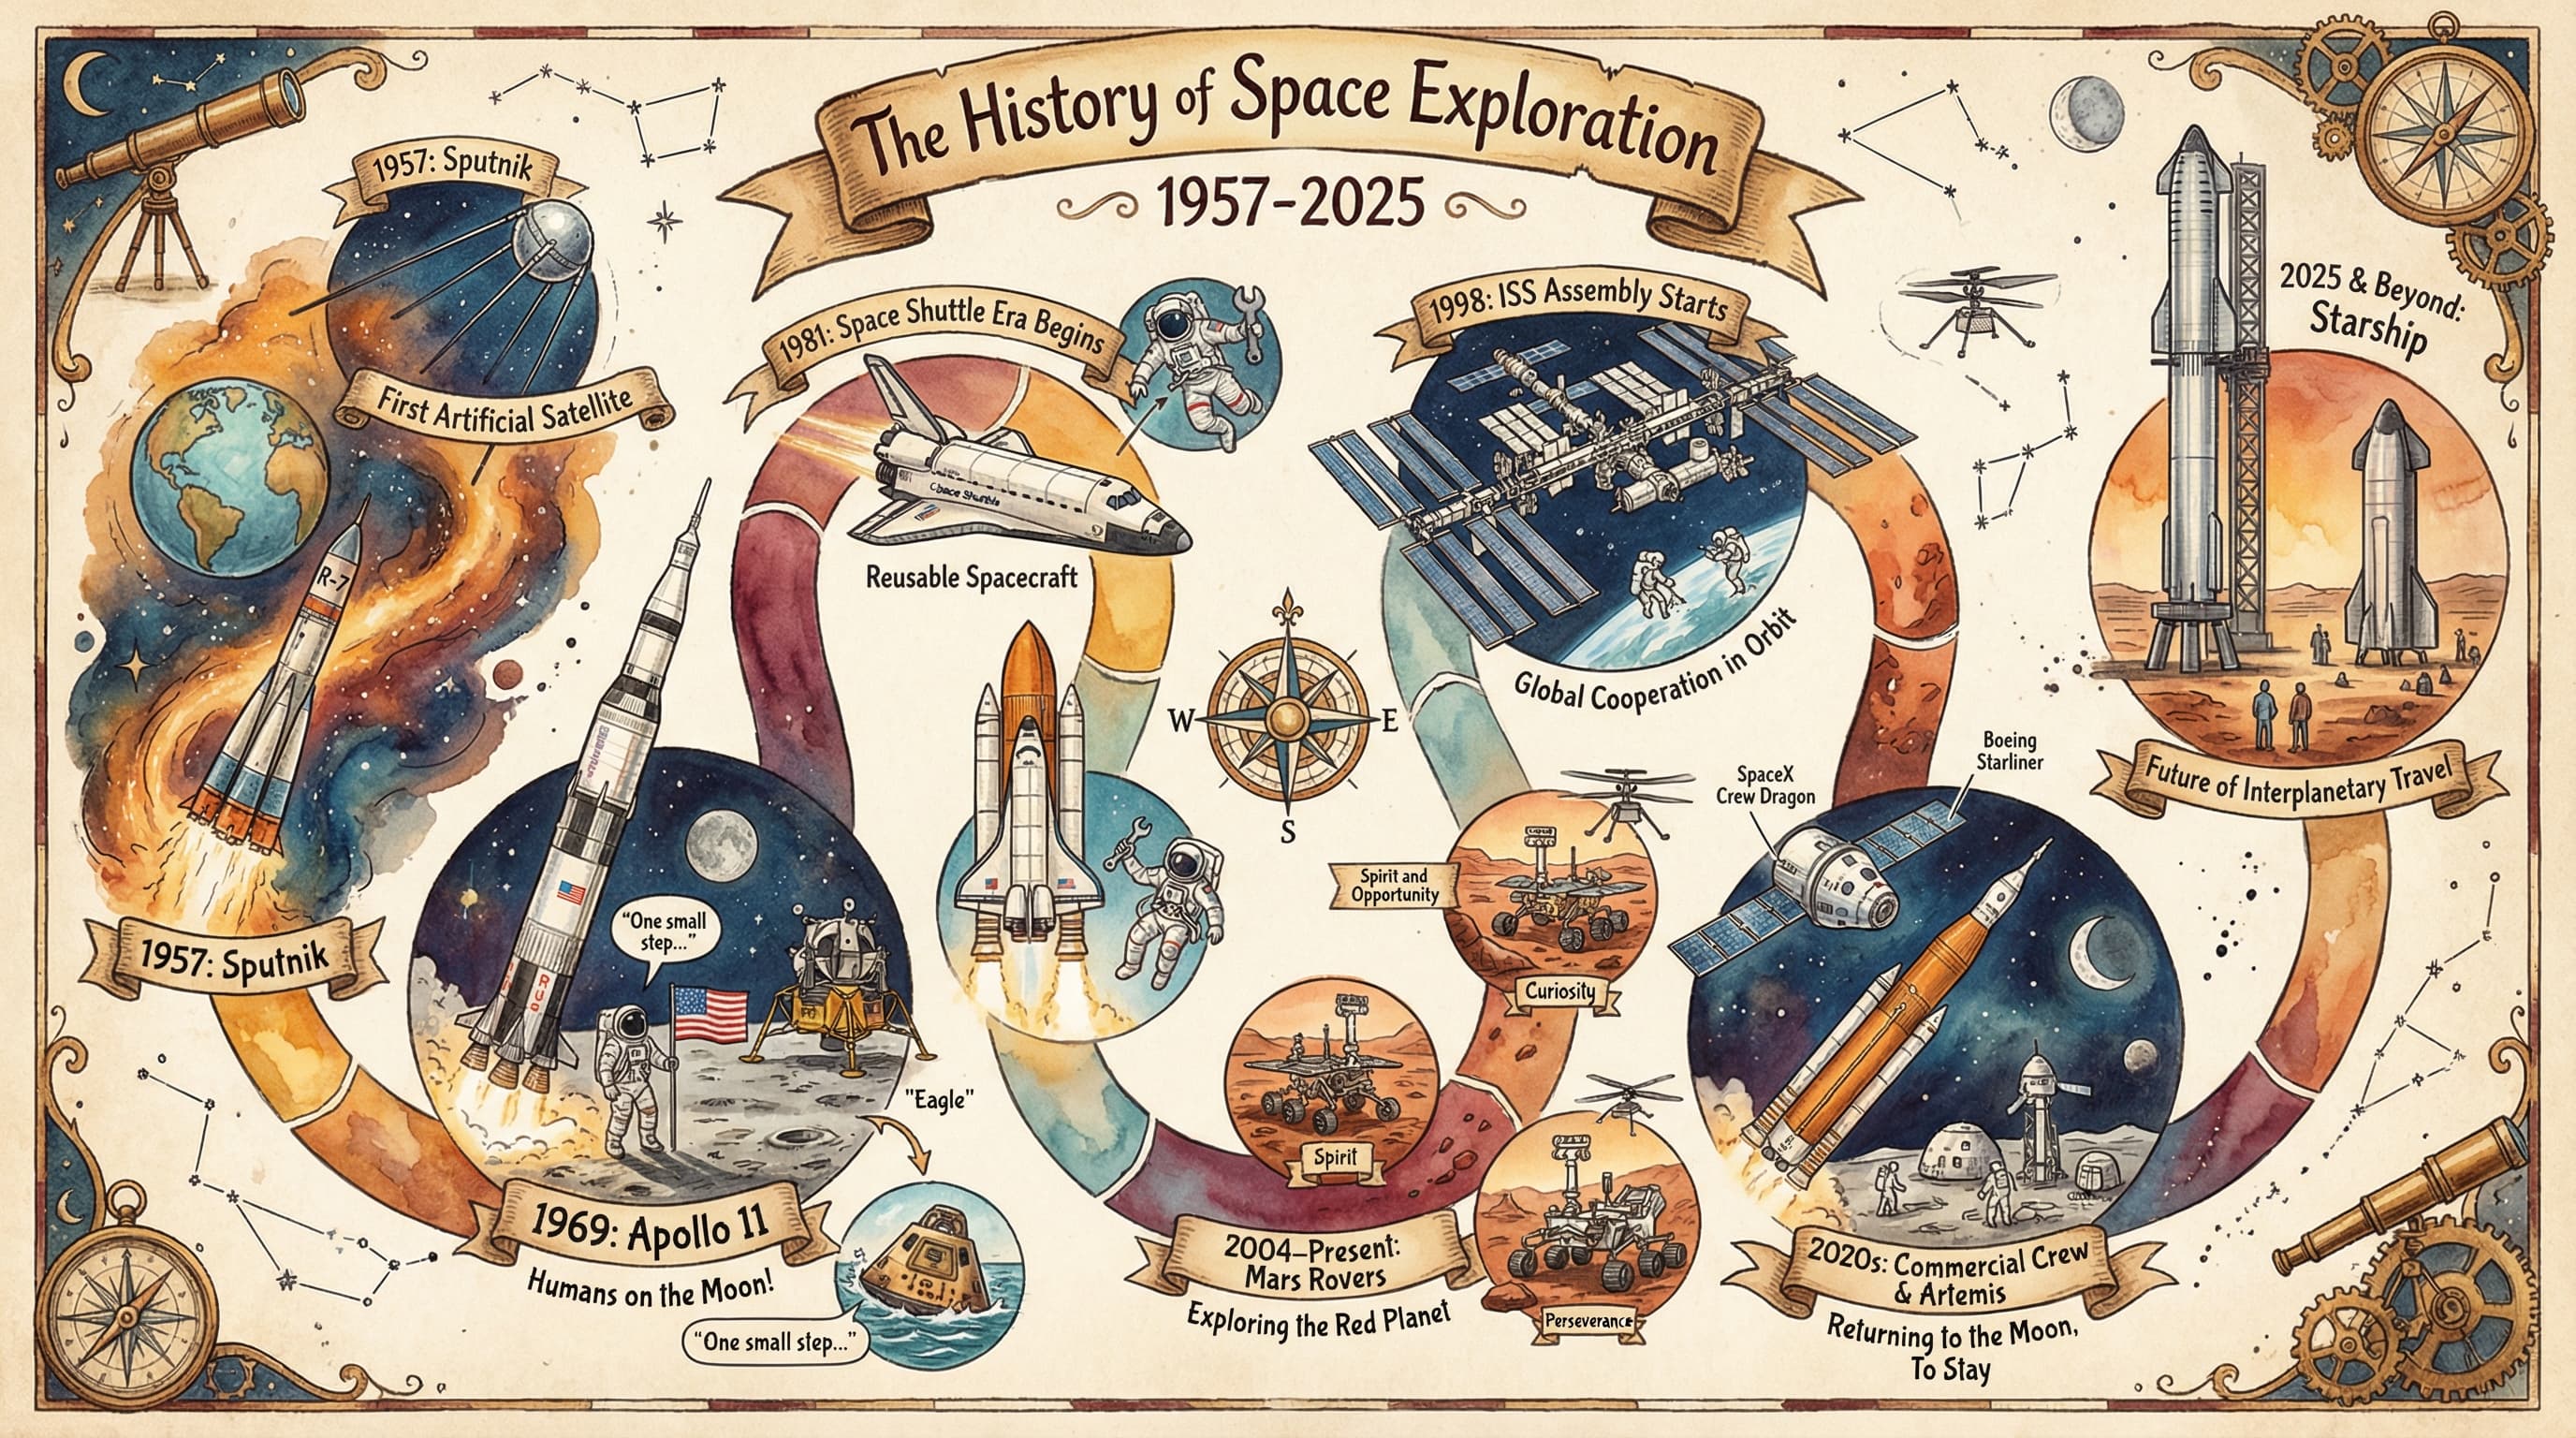
Craft Handmade
Warm, illustrated aesthetic with hand-drawn textures, watercolor elements, and winding narrative paths. Transforms timelines into visual journeys.
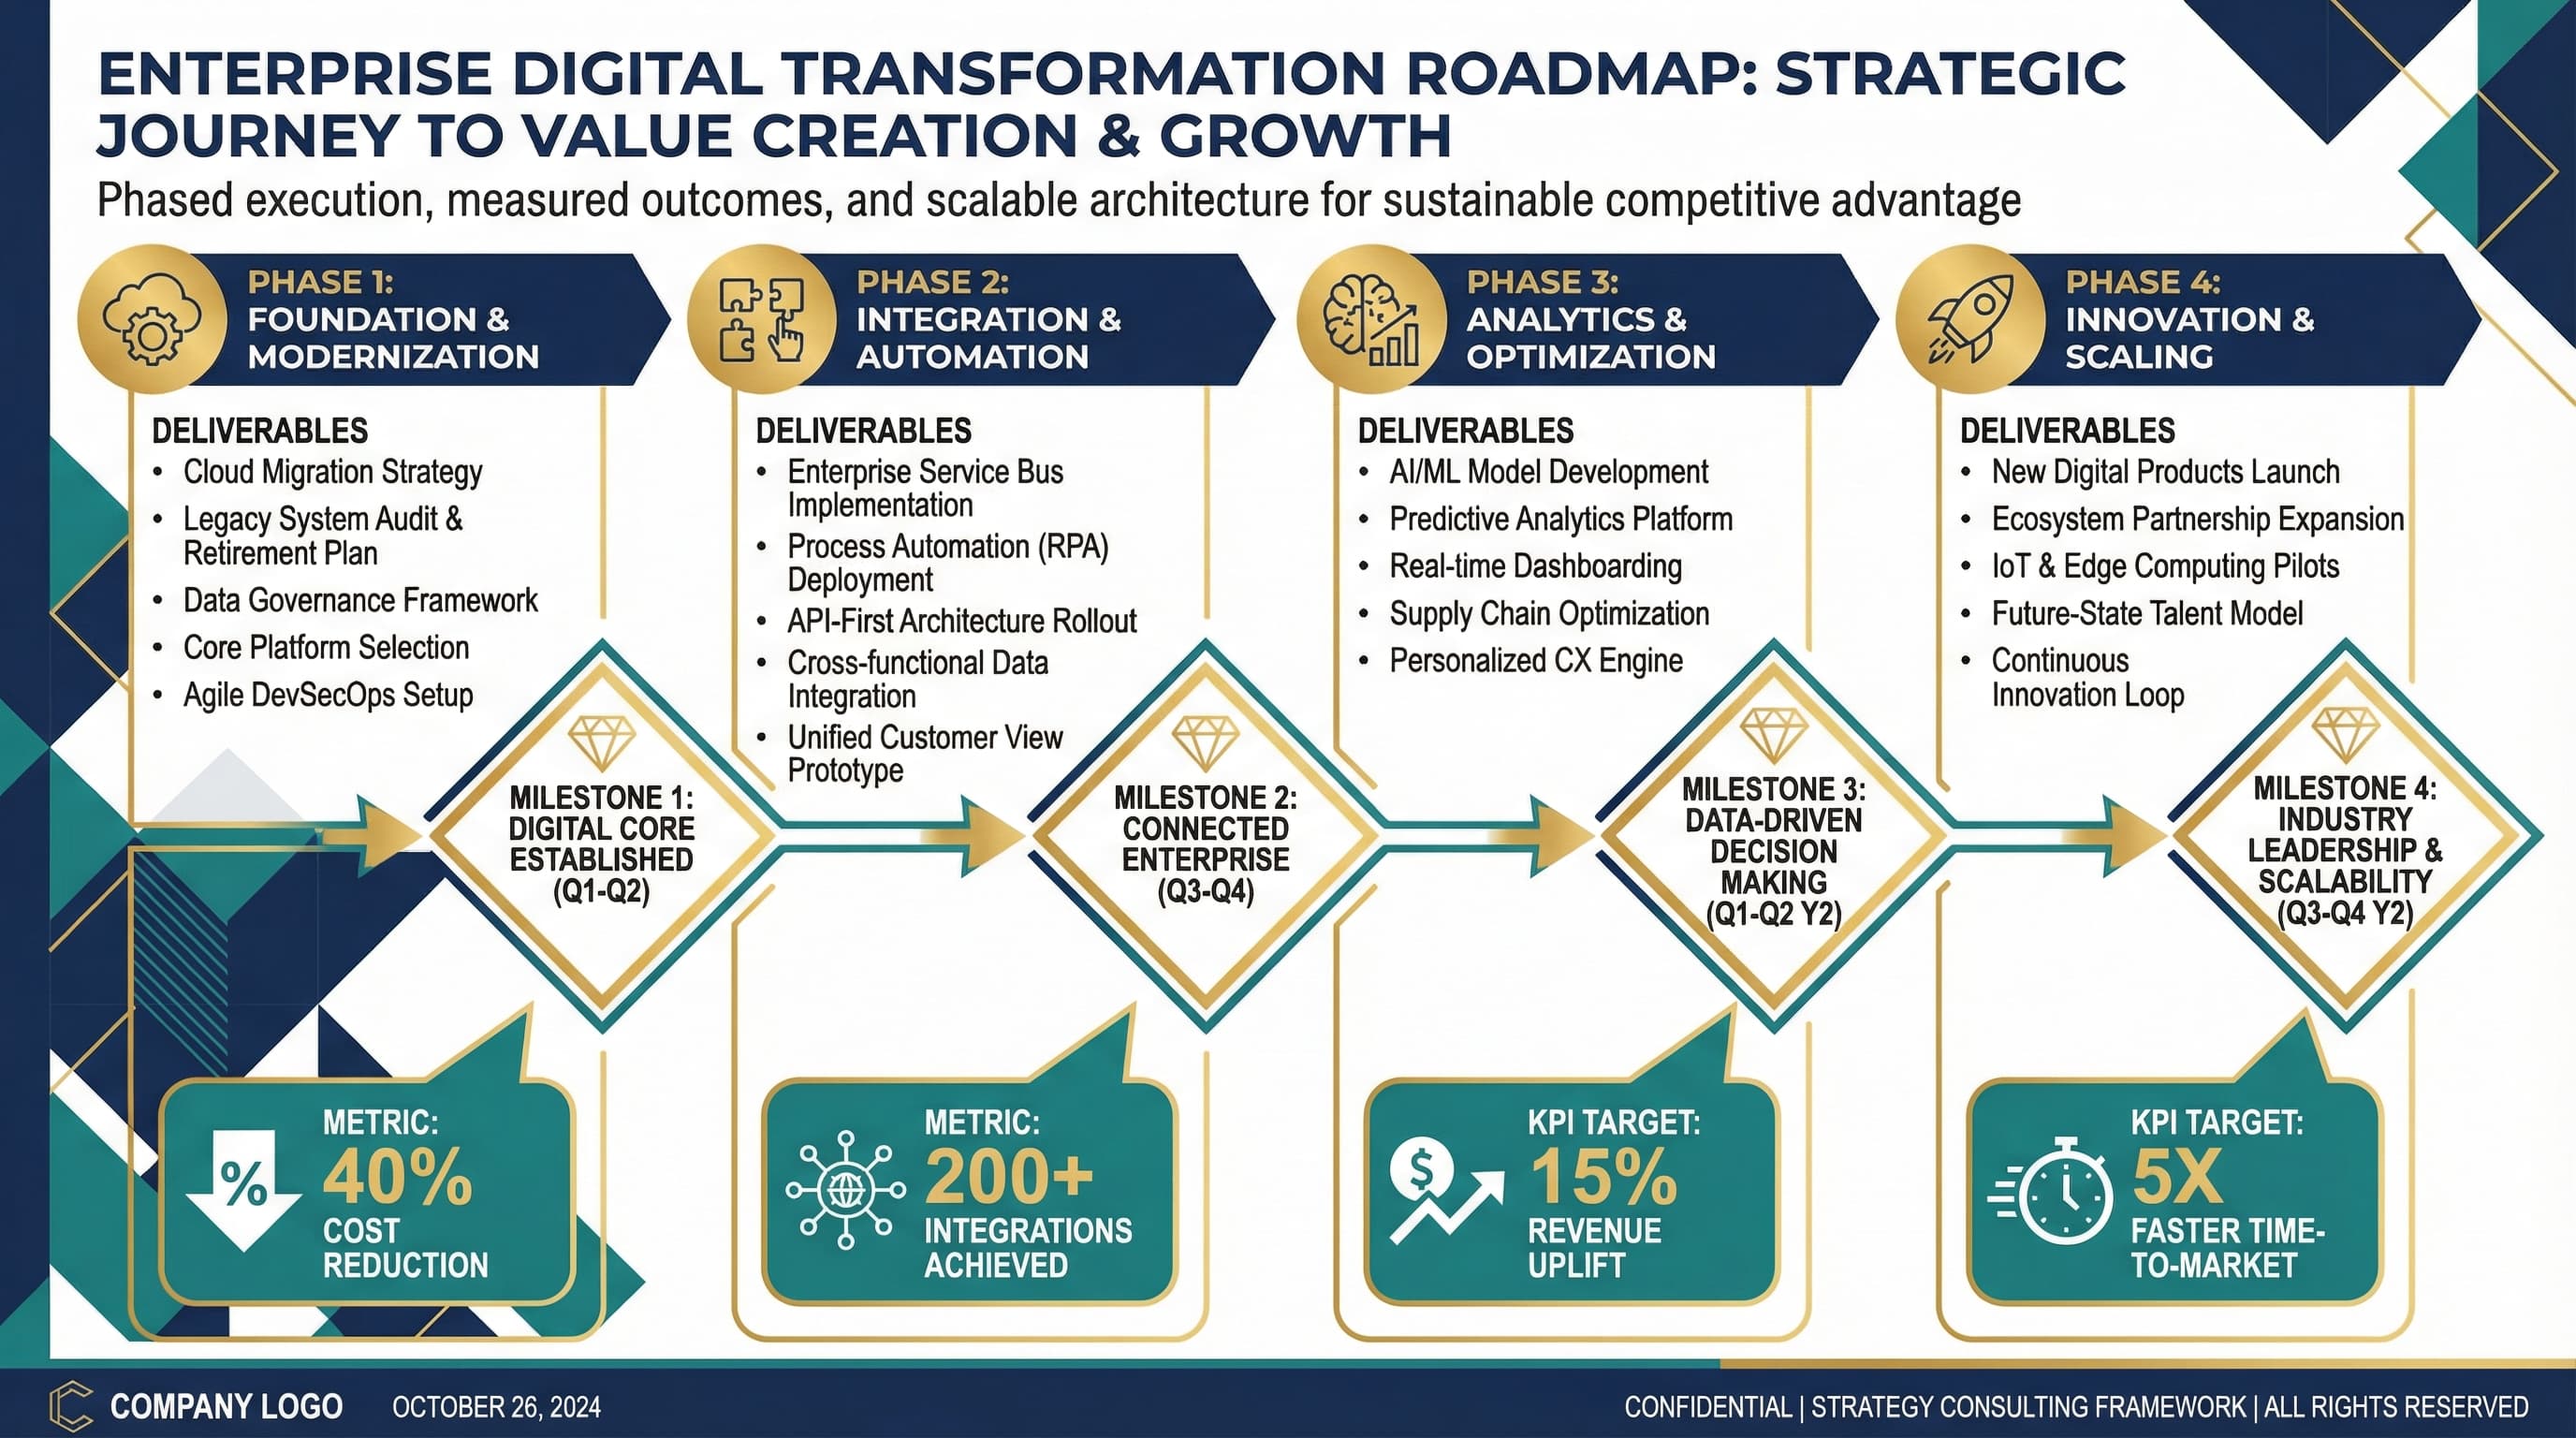
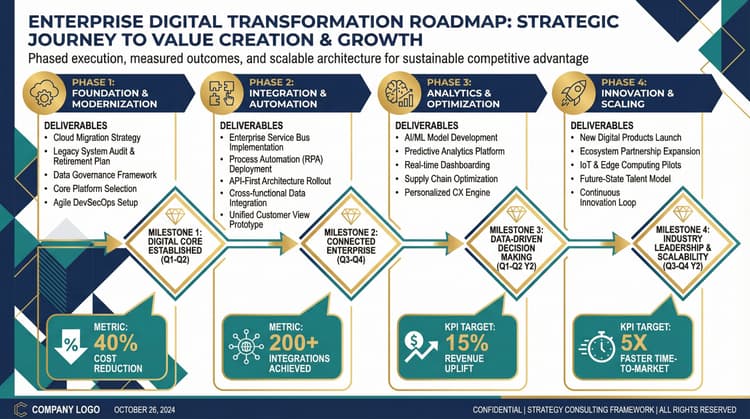
Strategy Framework
Structured enterprise frameworks with phased roadmaps, milestone markers, and metric callouts. Built for Fortune 500 strategy decks and C-suite alignment.
Start creating
From complexity,
clarity.
Free to try — no credit card required. Paste content and generate your first research-backed infographic in about 60 seconds.